Debugging in PhpStorm with Xdebug locally, in Vagrant or in Docker
Do you use PhpStorm and have you ever wondered what all those fancy debugging features were? Or could you just not get Xdebug running in Docker or your Vagrant machine? Wonder no more!
In this guide I will guide you through
- Setting up Xdebug locally, in Vagrant or in Docker
- Debugging in Phpstorm
You can follow along with the xdebug-example GitHub repository I have used throughout this guide.
Setting up Xdebug
Xdebug is a PHP extension developed by Derick Rethans for debugging using the DBGp protocol. Xdebug is the only debugging tool to implement the DBGp protocol. If you’re on Linux and use PECL, you can use the following command:
$ pecl install xdebug
If you’re on Windows or macOS or do not use PECL, you can follow the installation guide that can be found on the official website here.
After you’ve successfully installed Xdebug, you’re ready to configure it. Preferably create a file named xdebug.ini in /etc/php.d/ or /etc/php/conf.d or something else specific to your distribution or add the following to your php.ini:
[xdebug]
zend_extension=/usr/lib64/php/modules/xdebug.so
xdebug.remote_enable = 1
xdebug.remote_autostart = 1
With zend_extension we load the PHP extension we installed. If you’ve installed PHP extensions before, you may be wondering why you have enabled other extensions with just extension=x.so. This is because certain Xdebug features, such as step debugging, require zend. The path might be different for you depending on how you installed it.
With xdebug.remote_enable we enable the debugging features of Xdebug to be debugged from a remote location.
With xdebug.remote_autostart Xdebug will try to automatically debug every time you run anything in PHP. Normally you’d have to set a certain HTTP header when doing a HTTP request or add a certain PHP command line flag to your php command from the terminal. With this enabled you don’t have to set any HTTP header or command line flag.
Docker and Vagrant
If you’re following this guide whilst your application runs in Docker or Vagrant, you’ll need to include the xdebug.remote_host configuration. With xdebug.remote_host you tell Xdebug to connect to a certain host when debugging. By default this is localhost but for Docker you need the default gateway which is aliased to host.docker.internal or for Vagrant 10.0.2.2.
xdebug.remote_host=host.docker.internal
Once you’re done configuring, restart apache, nginx, php-fpm or whatever you use and lets start debugging!
Using it in PhpStorm
If you’re running your PHP code locally, there’s no need to configure anything in PhpStorm. If you’re running things in Docker or Vagrant, you need to setup the path mapping first. Withouth the path mapping PhpStorm wouldn’t debug anything because the file paths wouldn’t match.
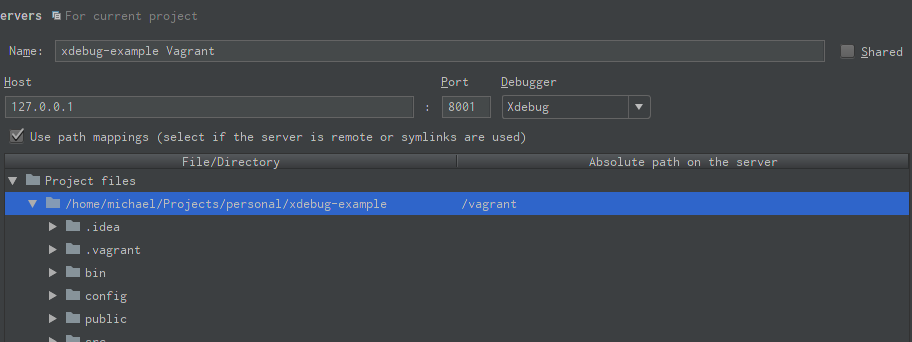
Open the settings window and browse to Languages & Frameworks > PHP > Servers. Add a new server pointing to the publicly accessible host and port. If you’re following along with the mtricht/xdebug-example repository from GitHub, for Vagrant this would be host 127.0.0.1 and port 8001. Check the Use path mappings checkbox and map the paths. For my repository and Vagrant this would be:

Once set, you’re ready to debug! First start listening for debugging connections on the top right:

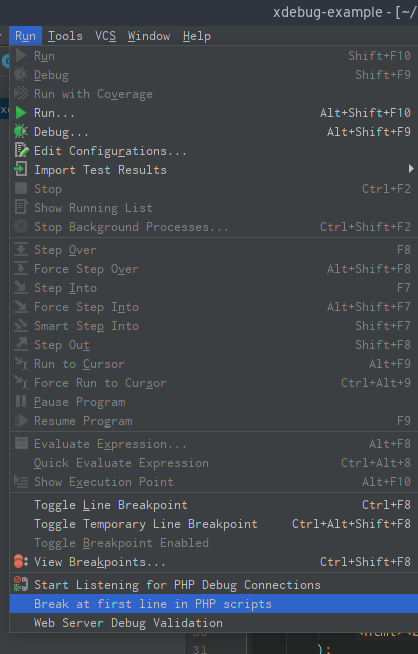
Next you can either set a breakpoint (by clicking on the left side of a line) or break at the first line:

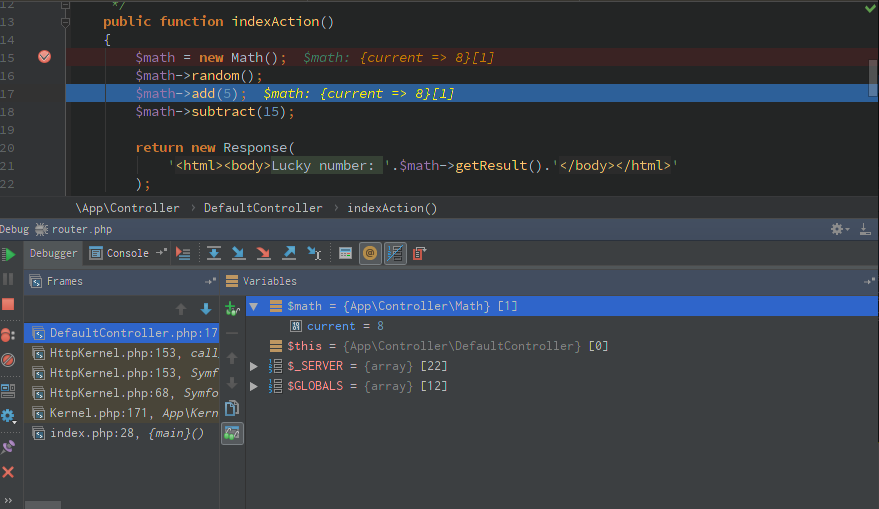
Once you’ve chosen one, it’s time to finally start debugging! Run the code where you set a breakpoint, through either a HTTP request or running a console command, and you’ll see a window pop up on the bottom:

Congratulations, you’re now debugging with Xdebug in PhpStorm! You should try to familiarize yourself with all the buttons PhpStorm has to offer. The most important ones are the arrow buttons on the top. Good luck!